Marketing ROI Measurement: Formulas That Hold Up to Scrutiny

The most accurate way to measure marketing ROI is incremental net profit ROI, which subtracts both the cost of goods sold and non-working costs (production, labor, tools) from attributed revenue before dividing by total campaign cost. If your team lacks the data to isolate incremental lift, fall back on the simple ROI formula, but treat it as a rough signal, not a board-ready number.
Simple ROI: (Revenue − Marketing Cost) / Marketing Cost × 100
Incremental net profit ROI: (Incremental Revenue − COGS − Non-Working Costs − Media Cost) / Total Cost × 100
Before you calculate anything, capture three inputs:
- Revenue directly attributed to the campaign, not total revenue during the campaign window
- Full campaign cost, including agency fees, tools, and internal labor
- A pre-campaign baseline so you can separate incremental performance from organic trend
Why this matters: Teams that count only media spend routinely understate true campaign cost by 40 to 80 percent compared to teams that log production, labor, and agency fees.
Key Takeaways
Incremental net profit ROI, which subtracts COGS and non-working costs from attributed revenue before dividing by total cost, is the most defensible way to measure marketing performance.
| Point | Details |
|---|---|
| Use the incremental formula | Subtract COGS and non-working costs from incremental revenue before dividing by total cost. |
| Separate baseline from lift | Strip organic and seasonal trend out of revenue before crediting a campaign with full credit. |
| Match KPIs to attribution windows | CAC, LTV, and CPA mean different things across paid search, SEO, and events with different windows. |
| Triangulate methods | Combine MMM, incrementality testing, and execution metrics rather than trusting one model alone. |
| Fix data infrastructure first | Clean UTM tagging and CRM integration determine whether any ROI number is auditable. |
| Connect reputation data to ROI | Aiseo’s ReviewSync links customer sentiment signals into performance dashboards for cleaner attribution. |
Table of Contents
- How Do You Calculate Marketing ROI Step by Step?
- Which KPIs Actually Feed Your ROI Calculation?
- Which Attribution Model Gives You the Most Accurate ROI?
- What Does Marketing Mix Modeling Actually Tell You?
- What Data Infrastructure Do You Need Before You Can Trust Any ROI Number?
- How Do You Avoid Reporting an Inflated ROI Number?
- How Does Aiseo Apply These Measurement Principles?
- What Should Marketing Teams Prioritize This Quarter?
- Where AISEO Tech Fits Into Your ROI Measurement Plan
- Sources
How Do You Calculate Marketing ROI Step by Step?
Marketing ROI measurement starts with a formula, but the formula only works if the inputs behind it are honest. HubSpot’s practical version of the calculation is built for exactly this: ((Leads × Lead-to-Customer Rate × Average Sale Price) − Cost) ÷ Cost × 100, a structure that forces you to show your work instead of hiding assumptions inside a single revenue number.
Here’s the calculation in three layers, from simplest to most defensible.
- Simple ROI. Revenue minus marketing cost, divided by marketing cost, times 100. If a campaign generates $50,000 in attributed revenue against a $10,000 spend, simple ROI is 400%, or a 5:1 ratio.
- Gross profit ROI. Same formula, but you replace revenue with gross profit (revenue minus COGS). This matters enormously for physical products or high-fulfillment-cost services, where topline revenue overstates what the business actually keeps.
- Incremental net profit ROI. You isolate the lift the campaign created over baseline, apply gross margin, then subtract non-working costs. This is the version Avinash Kaushik argues avoids overstating returns, because it removes both the cost of production and the revenue you would have earned anyway.
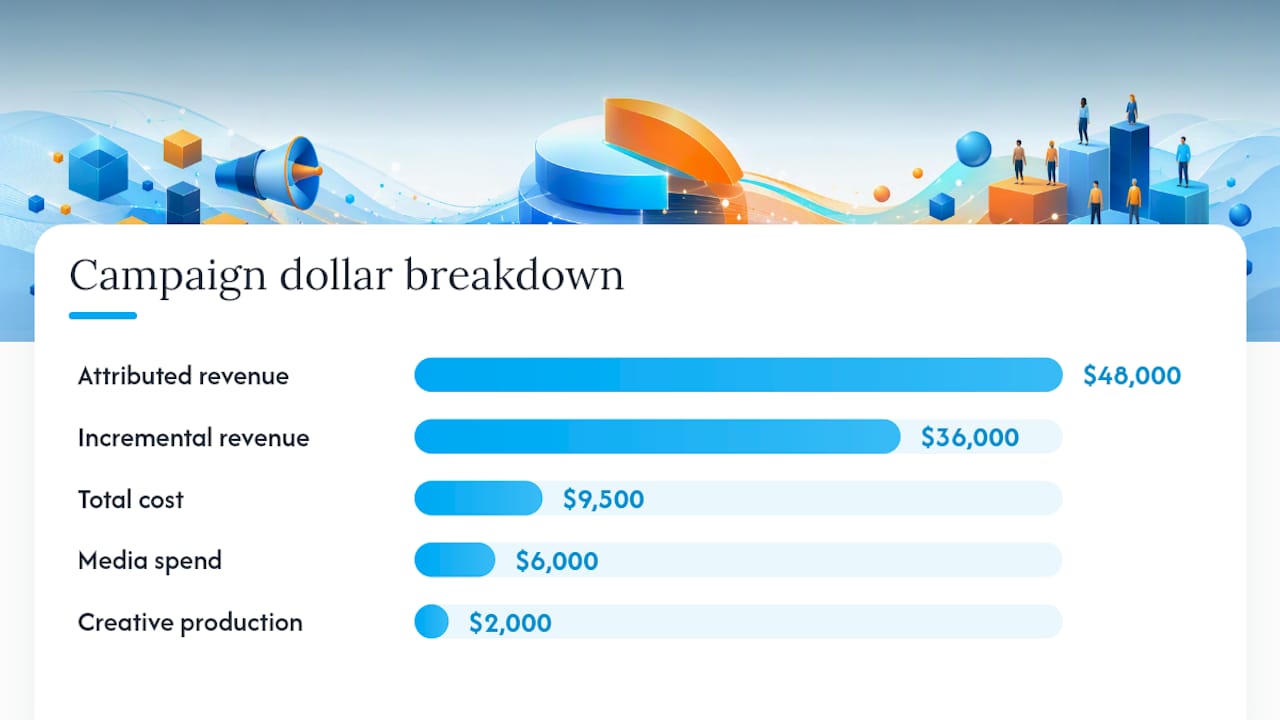
Walk through a real scenario. That’s $48,000 in attributed revenue. Media spend was $6,000, creative production cost $2,000, and internal labor ran roughly $1,500. Total cost: $9,500.
But if your baseline data shows the business would have closed 10 of those 40 deals anyway through organic pipeline, incremental revenue drops to $36,000.
Which KPIs Actually Feed Your ROI Calculation?
Marketing effectiveness metrics only earn their keep when they connect directly to the ROI formula above. A dashboard full of impressions and engagement rate looks busy but tells you nothing about whether the campaign paid for itself.
Five metrics do the real work:
- CAC (Customer Acquisition Cost): total cost divided by new customers acquired; the denominator in every efficiency comparison.
- LTV/CLV (Lifetime Value): average revenue per customer over their full relationship, used to judge whether your CAC is sustainable.
- ROAS (Return on Ad Spend): revenue divided by ad spend specifically, narrower than ROI because it ignores non-media costs.
- CPL (Cost Per Lead): total spend divided by leads generated, useful for top-of-funnel channels like SEO and content.
- CPA (Cost Per Acquisition): cost divided by conversions, the bridge metric between CPL and CAC.
Attribution windows change what these numbers mean channel to channel. Paid search conversions typically get credited within a 1 to 7 day window; social ads often stretch to 28 days on-platform (frequently inflating results, which we’ll cover next); email tends to convert fast, within 24 to 72 hours; SEO and organic content operate on a 3 to 6 month horizon because rankings and trust compound slowly; events need 30 to 90 days because sales cycles from in-person contact rarely close on the spot.
Margin structure also determines what counts as “good.” A 5:1 ROI is a widely cited benchmark for a strong campaign, but a business with 20% margins needs a much higher ratio to hit the same net profit as a business running 70% margins on the same revenue.

Pro Tip: Calculate CAC and LTV together before you calculate ROI. A campaign with a fantastic ROI but a CAC that exceeds three-year LTV is buying revenue you can’t afford to keep buying.
Which Attribution Model Gives You the Most Accurate ROI?
None of them, used alone. Last-click, first-click, linear, time-decay, and data-driven attribution each answer a different question, and all five share the same weakness: they describe correlation along a path, not causation.
- Last-click credits the final touchpoint before conversion, overweighting bottom-funnel channels like branded search and retargeting.
- First-click credits the first touchpoint, overweighting awareness channels and ignoring what actually closed the deal.
- Linear splits credit evenly across every touchpoint, which is fair in theory and useless in practice because not every touch matters equally.
- Time-decay weights recent touches more heavily, a reasonable compromise for longer sales cycles.
- Data-driven attribution uses algorithmic modeling to assign credit based on observed conversion patterns, the most sophisticated option but still dependent on the quality of the tracking feeding it.
The bigger problem is platform bias. Ad platforms routinely over-report conversions relative to what your order system or CRM actually books, because each platform’s pixel takes credit for any conversion it can plausibly claim, regardless of what other channels touched the same customer.
Incrementality testing solves this by measuring causation directly instead of guessing at credit allocation.
- Split your audience into a treatment group (sees the campaign) and a control/holdout group (does not), matched on relevant characteristics.
- Run the test long enough to reach a sample size that can detect a meaningful lift, typically several weeks for most mid-size campaigns.
- Compare conversion rates between groups to calculate uplift: (treatment conversion rate − control conversion rate) / control conversion rate.
- Convert that uplift into incremental revenue by multiplying uplifted conversions by average order value, then apply gross margin to get incremental net profit.
Run one holdout test per quarter on your highest-spend channel and you’ll have a causal benchmark to calibrate every attribution model against.
What Does Marketing Mix Modeling Actually Tell You?
Marketing Mix Modeling (MMM) measures how each channel contributed to overall business results over time, using statistical regression against sales data, spend levels, and external variables like seasonality or pricing changes. It answers a different question than incrementality testing: not “did this specific campaign work,” but “how should I allocate next quarter’s budget across channels.”
MMM’s real value is scenario planning.
The tradeoffs are real, though:
- MMM needs aggregated data over months or years, so it’s a poor fit for fast-moving digital campaigns that launch and end in weeks.
- Results are sensitive to which external controls you include; leave out a competitor promotion or a macroeconomic shift and the model misattributes that effect to your channels.
- Seasonality has to be modeled explicitly, or the algorithm will credit your Black Friday email campaign with lift that was really just December.
MMM and incrementality experiments work best together, not as substitutes for each other. BCG frames this as part of a broader “four-legged stool” of measurement, one that combines modeling, experiments, customer insights, and execution metrics rather than betting everything on a single method. MMM gives you the directional allocation; incrementality experiments confirm whether that direction is actually causal, since experiments validate causality for specific tactics while MMM handles channel-level allocation.
What Data Infrastructure Do You Need Before You Can Trust Any ROI Number?
Every ROI formula in this guide depends on clean data underneath it. Build the stack in this order:
- UTM discipline. Standardize a naming convention (source, medium, campaign, content) across every team touching a link, and audit it monthly. Inconsistent tagging is the single most common reason attribution reports don’t match reality.
- CRM configuration. Set up fields that capture source, first-touch channel, opportunity stage, and closed revenue, so every lead has a traceable path from click to booked dollar. This is what makes connecting marketing data to CRM systems the difference between an estimate and an audit-ready figure.
- Reconciliation. Compare platform-reported conversions against your accounting or order management system monthly, and add non-media costs (labor, tools, agency retainers) to a single campaign ledger before calculating ROI.
- Dashboard cadence. Show spend and lead volume weekly, CAC and channel ROI monthly, and incremental net profit ROI quarterly, once enough data has accumulated to run it credibly.
How Do You Avoid Reporting an Inflated ROI Number?
Four checks catch most inflated ROI claims before they reach a boardroom.
- Confirm every cost is in the ledger: media, labor, tools, agency fees, and production, not just ad spend.
- Strip out organic and seasonal trend from your revenue baseline before crediting the campaign with the full lift.
- Verify platform-reported conversions against your order system; treat any gap over 10 to 15% as a tagging or attribution problem to fix, not a number to report.
- Match your measurement window to the channel’s real sales cycle. Most channels need 3 to 6 months of cohort data before a ROI read is stable.
Governance matters as much as the math. Set a single naming standard, designate one dashboard as the source of truth, and put a recurring review on the calendar with finance so ROI numbers get challenged before they’re presented, not after.
How Does Aiseo Apply These Measurement Principles?
Aiseo’s approach to marketing ROI measurement leans on AI-driven tracking that connects campaign data to CRM outcomes automatically, closing the gap between what a platform reports and what actually closes. ReviewSync adds a layer most attribution models miss entirely: reputation signals and review sentiment, which correlate closely with conversion rate and customer lifetime value.
- AI-assisted tagging audits that catch broken UTMs before they corrupt a month of reporting
- Reputation data from ReviewSync layered into channel performance dashboards
- Example outcome format: “[Client name] reduced attribution gaps by [X%] and improved incremental net profit ROI from [X%] to [Y%] over [timeframe]”
What Should Marketing Teams Prioritize This Quarter?
If you fix one thing this quarter, fix your tagging audit. Everything downstream, from attribution to incrementality testing, inherits whatever mess sits in your UTM structure.
For teams with limited data resources, the order is: run one holdout test on your biggest channel, clean up tagging, then compare CAC against LTV before touching anything else. Pick a single metric this month and track it properly instead of half-tracking ten.
Where AISEO Tech Fits Into Your ROI Measurement Plan
Building the data stack this guide describes, clean tagging, CRM integration, honest cost accounting, takes real engineering time most marketing teams don’t have sitting idle. That’s the gap Aiseo closes.

Aiseo’s reputation management platform connects review and sentiment data directly into your performance dashboards, so the customer insights leg of your measurement stool isn’t a separate manual project. Combined with Aiseo’s SEO, SEM, and analytics services, the result is cleaner attribution, ROAS numbers you can defend to finance, and dashboards that pull from one integrated source instead of five disconnected exports. Clients typically see fewer disputes between marketing and finance over which number is “real,” simply because there’s only one number to argue about.
If your team is rebuilding its measurement approach this quarter, get a reputation and marketing performance assessment and see where your current tracking gaps are costing you the most.
Sources
- Four-legged approach to understanding marketing ROI (BCG)
- The best marketing ROI formula: Incremental net profit ROI (Avinash Kaushik)