For Marketers: Beat Mid Single Digits in Landing Page Conversion Rate

A strong landing page converts above its industry median, and right now that median sits in the mid-single digits across most sectors. Top-quartile pages clear double digits, according to Unbounce’s benchmark analysis of over 41,000 pages and 57 million-plus conversions. The rest of this article breaks down those benchmarks by vertical, shows you how to measure your own rate correctly, and walks through the tactics and testing process that actually move the number.
TL;DR:
- Top-quartile landing pages achieve conversion rates into the high double digits, especially in SaaS, local lead generation, and some high-intent verticals.
- Correctly measuring LPCR requires counting sessions rather than users, deduplicating conversions, and segmenting data by traffic source and device for accurate benchmarking.
- The biggest factors influencing conversion include message match, a single clear call-to-action, minimal form friction, trusted signals, and fast, mobile-optimized page load times.
- Testing should prioritize low-effort, high-impact changes like headlines, images, and form simplification, with sample size estimations aligning to actual traffic volume.
- Using a combination of analytics, A/B testing, session replays, and personalization tools helps identify friction points and optimize landing pages effectively.
Table of Contents
- Landing Page Conversion Rate Benchmarks By Industry
- How to Calculate Landing Page Conversion Rate Correctly
- What Affects Landing Page Conversion the Most
- Proven Tactics to Increase Landing Page Conversions
- Why Conversion Rates Vary by Channel and Device
- Building a CRO Testing Roadmap That Actually Works
- Tools and Support for Measuring and Improving Conversion Rates
- Author Perspective: Lessons From Running CRO Projects
- How Aiseo Helps You Act on These Benchmarks
- Sources
- FAQ
Landing Page Conversion Rate Benchmarks By Industry
Benchmarks only mean something when you compare your page to the right peer group. A cold paid-traffic campaign and a warm email list will never post the same numbers, even on an identical page.
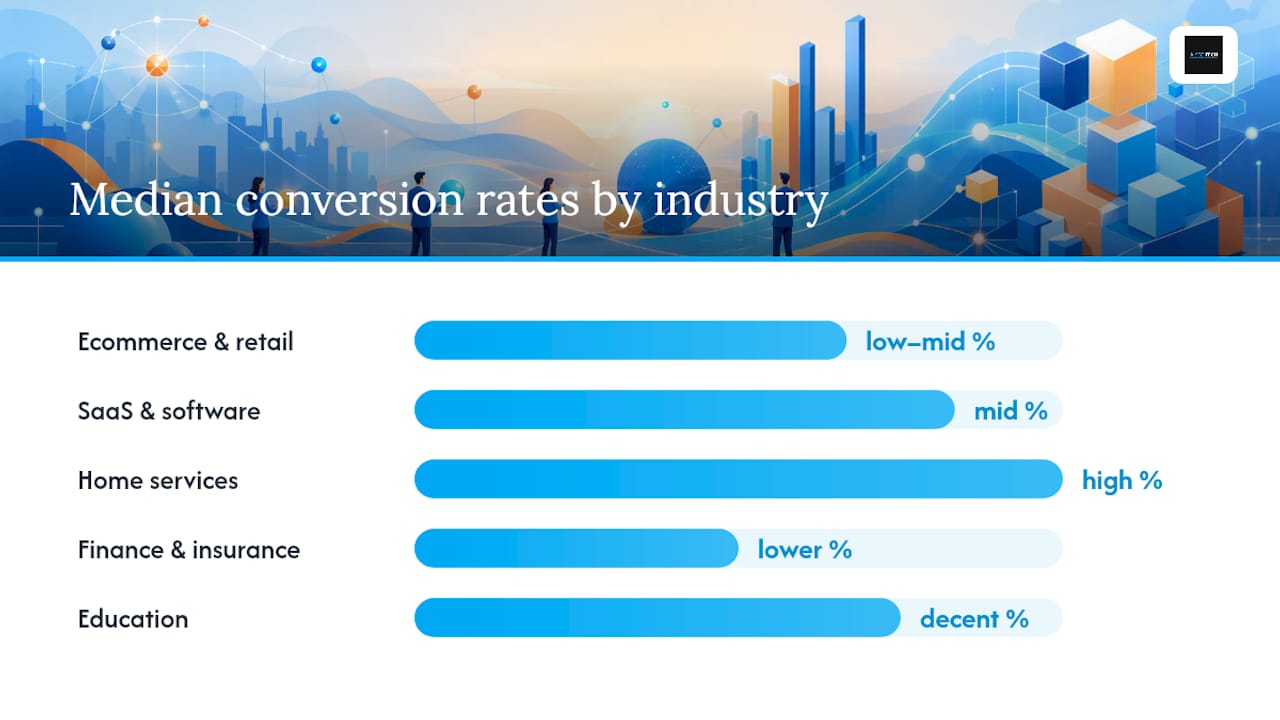
Unbounce’s Q4 2024 data draws from a large enough sample, tens of millions of pageviews across more than 41,000 landing pages, to give marketers a real baseline rather than a guess. The top 10% of pages in that dataset often convert significantly higher than the median for their category, which tells you the gap between “fine” and “great” is wide.
Here’s roughly where the medians and upper brackets land by vertical:
- Ecommerce and retail: low-to-mid single digits at the median; top performers reach into the high single digits.
- SaaS and software: slightly higher medians than ecommerce, since visitors often arrive with more purchase intent; top-quartile SaaS pages regularly hit double digits.
- Home services and local lead generation: some of the strongest median rates of any vertical, largely because the offer (a quote, a callback) requires low commitment.
- Finance and insurance: medians trail behind lead-gen categories due to higher-consideration purchases and stricter form requirements.
- Education: decent medians, boosted by evergreen intent (someone searching for a course is already leaning toward converting).
- Entertainment and media: wide variance depending on whether the goal is a free signup or a paid subscription.
Sample size matters more than most marketers assume. Traffic source and offer type swing the numbers just as hard: a $19 ebook download and a $50,000 enterprise software demo will never share a realistic benchmark, even in the same industry.
How to Calculate Landing Page Conversion Rate Correctly
The formula itself is simple, but most teams get the inputs wrong. Klipfolio defines landing page conversion rate (LPCR) as conversions on the landing page divided by sessions that landed on that specific page, not total site traffic and not total leads from every channel combined.
- Count sessions, not users. A single visitor can generate multiple sessions across a reporting period, and mixing the two inflates or deflates your denominator depending on your analytics setup.
- Deduplicate conversions. If someone submits a form, hits back, and resubmits, that’s one conversion, not two. Session-scoped tracking and deduplication rules prevent inflated conversion rates from reloads and repeat submissions.
- Align your timeframe. Compare sessions and conversions from the same date range. A common mistake is counting conversions from a 30-day window against sessions from a 7-day window because two different reports pulled at different times.
- Track driver metrics alongside LPCR. Bounce rate, click-through rate to your call-to-action, form completion rate, and page load speed all explain why your LPCR moved, even when the top-line number alone doesn’t tell you what to fix.
- Segment before you report. Break results out by channel, device, new versus returning visitor, and campaign. A blended average across paid and organic traffic hides more than it reveals.
Get this measurement layer wrong and every benchmark comparison downstream becomes useless. You can’t optimize what you’re miscounting.
What Affects Landing Page Conversion the Most
Before running a single test, audit these five areas. In most CRO engagements, they account for the majority of the measurable lift, according to the practical patterns FormAssembly documents across high-converting landing page examples.
- Message match. Your headline should mirror the ad, email subject line, or search query that brought the visitor there. A mismatch between what someone clicked and what they land on is one of the fastest ways to spike bounce rate.
- A single primary call-to-action. Pages with one clear CTA, consistent button copy, a contrasting color, and placement above the fold, convert better than pages offering visitors three or four competing actions.
- Form friction. Every additional field past the essentials measurably drops completion rates. Progressive profiling (asking for more information after the first conversion, not during it) and inline validation that catches errors before submission both reduce abandonment.
- Trust signals placed where doubt occurs. Testimonials near the CTA, client logos near the top, and specific stats (not vague claims) all work better when placed at the exact moment a visitor hesitates, not buried in a footer.
- Page speed and mobile viewport checks. A page that loads slowly or renders awkwardly on a phone loses visitors before they ever read the headline.
Pro Tip: Run your form through a “one-thumb test” on an actual phone before launch. If you can’t complete every field, dropdown, and submission using only your thumb, your mobile visitors are hitting the same friction and bailing before they convert.
Proven Tactics to Increase Landing Page Conversions
Once you’ve triaged the basics, move into structured experimentation. Rank tactics by effort versus expected impact, and start with the cheap, fast wins before touching anything structural.
- Test headline and hero image variations first. These are the lowest-effort, highest-visibility changes on the page, and they’re often the fastest way to validate or kill a message-match hypothesis.
- Cut form fields to the minimum needed for a first conversion. Field count correlates directly with completion, and pages with three or four fields tend to post noticeably higher medians than pages asking for eight or more, according to industry benchmark comparisons. Save the deeper qualifying questions for a follow-up email or sales call.
- Build dedicated landing pages for every paid campaign instead of routing traffic to a general product page. Dedicated pages that preserve message match and strip out site navigation convert at twice the rate or better compared to sending paid clicks to a generic page loaded with distractions.
- Personalize by traffic source and creative. A visitor coming from a retargeting ad that mentions a specific product should land on a page referencing that same product, not a generic homepage-style layout. Dynamic content blocks that swap headlines or images based on UTM parameters are a relatively low lift for the return.
- Use social proof strategically, and use scarcity honestly. Real customer counts, verified review scores, and specific outcome numbers build more trust than generic praise. If you’re using urgency (limited spots, a closing deadline), make sure it’s true. Fabricated scarcity erodes trust the moment a visitor notices the “limited time offer” has been running for six months.
- Build a follow-up flow for visitors who don’t convert on the first visit. Exit-intent offers, retargeting sequences, and abbreviated micro-conversions (a newsletter signup instead of a full demo request) reclaim leads who weren’t ready to commit but were still interested enough to read your page.
Pro Tip: Track downstream metrics, not just form fills. A test that doubles your form completions but fills your pipeline with unqualified leads hasn’t actually improved anything, it’s just moved the problem to your sales team.
Ad copy and landing page copy need to work as a matched pair. If you’re running paid campaigns, review your ad messaging alongside your landing page headline to confirm they’re telling the same story.
Why Conversion Rates Vary by Channel and Device
Comparing your paid search landing page to an industry-wide average is a common benchmarking mistake. Traffic source shapes intent, and intent shapes conversion rate more than almost any design choice.
- Paid search traffic tends to convert relatively well because visitors are actively searching for a solution; they clicked an ad that matched a query they typed themselves.
- Paid social traffic usually converts lower than paid search, since visitors are interrupted mid-scroll rather than actively looking for what you offer.
- Organic traffic varies widely depending on search intent, but pages ranking for high-intent keywords often outperform paid social by a wide margin.
- Email traffic frequently posts the highest conversion rates of any channel, because the audience already has a relationship with your brand.
Mobile visitors convert at roughly 60% to 70% of the desktop rate across many industries, and the gap widens further in ecommerce. Before blaming your offer or your copy, check whether your mobile experience has slow load times, cramped tap targets, or a checkout flow that requires zooming to read. When mobile conversion lags significantly, prioritize input-focused fixes, autofill, single-tap phone links, and keyboard-aware form fields, before touching your creative.
Match your benchmark to your traffic source. A 3% landing page conversion rate on a cold paid social campaign might be excellent, while the same number on a branded email send could signal a real problem. Review your paid search setup if you suspect your campaign targeting, not your landing page, is the real bottleneck.
Building a CRO Testing Roadmap That Actually Works
Random testing wastes traffic. A structured roadmap gets you reliable answers faster, even when your traffic volume is limited.
- Prioritize using impact, confidence, and cost. Score each proposed test on how much it could move the needle, how confident you are in the hypothesis based on existing data, and how expensive or slow it is to build. Tackle high-impact, low-cost tests first.
- Estimate sample size before you launch. A test that needs 10,000 visitors per variant to reach significance isn’t realistic for a page getting 500 visits a month. Match your test complexity to your actual traffic volume, and don’t call a winner early just because one variant looks ahead after three days.
- Write a real hypothesis, not just a change. “If we cut the form to four fields, completion rate will rise because friction drops” gives you something to learn from, win or lose. A vague “let’s try a new button color” doesn’t.
- Set a rollback rule before you start. Decide in advance what a losing variant looks like and commit to reverting it, rather than letting a personal favorite design run indefinitely on gut feeling.
- Evaluate downstream business metrics, not just LPCR. Track the test’s effect on lead quality, cost per acquisition, and eventual customer conversion, not just the immediate form-fill rate. A prioritization framework that weighs impact against cost keeps your testing calendar focused on the changes most likely to matter.
Tools and Support for Measuring and Improving Conversion Rates
Getting from “we think this page underperforms” to “here’s exactly why and how we fixed it” usually requires a stack of tools working together, not a single dashboard.
- Analytics dashboards pull together LPCR, bounce rate, and CTA click-through in one view so you can see which driver metric moved before and after a change.
- A/B testing platforms let you run controlled experiments on headlines, forms, and layouts without guessing at outcomes.
- Session replay tools show you exactly where visitors hesitate, scroll past, or abandon a form, catching friction points a spreadsheet never will.
- Personalization engines swap page content based on traffic source or audience segment automatically, once you’ve defined the rules.
- Form optimization tools flag which fields cause the most drop-off, often the fastest fix available.
- Reputation and review management systems feed real customer trust signals directly onto your page, which matters given how heavily trust signals influence conversion.
AI has changed how fast teams move through this stack, mainly by speeding up hypothesis generation and personalization logic that used to take days of manual segmentation. AISEO Tech applies this approach across client reputation management work through ReviewSync, which pulls verified reviews across platforms into widgets and trust signals landing pages can display directly.
Author Perspective: Lessons From Running CRO Projects
The most common mistake teams make is expecting a redesign to double conversion rates in one sprint. Real, durable gains usually come from a handful of small, correctly measured wins compounding over two or three months, not one dramatic overhaul. Review Aiseo’s analytics resources for a closer look at measurement setups that catch these wins early.
— Prasad
How Aiseo Helps You Act on These Benchmarks
Once you know where your landing page conversion rate stands against these benchmarks, the harder part is fixing the gap without hiring a full internal analytics team. Aiseo works with businesses on the analytics, reporting, and reputation-management pieces that feed directly into conversion performance, including ReviewSync for pulling verified customer reviews into the trust signals your landing pages need.
If your team is testing landing pages under real traffic constraints, tools like the 1-Hour Book Publisher funnel-building process offer a fast structural approach worth reviewing alongside your own roadmap. For a broader look at how AI can accelerate campaign measurement and personalization, visit Aiseo’s homepage and see where a data-driven partner fits into your next testing cycle.
Sources
- What’s a good conversion rate? (Based on 41,000 landing pages)
- 20 high-converting landing page examples (FormAssembly)
- Landing page performance optimization (Klipfolio)
FAQ
What’s a good conversion rate for a landing page?
A good rate beats your industry’s median, which sits in the mid-single digits across most sectors, according to Unbounce’s benchmark data. Top-quartile pages often clear double digits.
What is the average landing page conversion rate by industry?
Averages vary widely, with home services and lead generation typically posting some of the highest medians, and finance and insurance trailing due to higher-consideration purchases and stricter form requirements. Ecommerce and SaaS fall in between, with SaaS often edging slightly higher due to stronger purchase intent.
How much should I charge for a landing page?
Pricing depends heavily on scope, whether the page includes custom design, copywriting, A/B testing setup, and analytics integration, and agencies typically quote based on project complexity rather than a flat rate. Businesses evaluating outsourced help often compare project-based quotes against the cost of building and maintaining that expertise in-house.